Blog for Mr Wilkinson's History and Geography classes at Haileybury Almaty. Posts by Mr Wilkinson and his students.

Tuesday 28 November 2017

Where Geography and History Meet: The Roman Empire and Physical Features.

As an end of term project, Form 1 brought together their knowledge of the Romans from History and physical features from Geography to create 3D maps of the Roman Empire.

These maps are now proudly on display in the classroom. As you will see from the images below there were some very creative touches. Well done to Sean, Andrew and Jimin who have won prizes for best presentation and Chow Wan Ting, Kiera and Hee Won who won prizes for best Geographical and Historical information.


Work in progress - step 1 - mapping out the Roman Empire and Physical features and making mountain ranges using paper-mache


Work in progress - step 2 - Panting and adding labels and special artistic features


Sunday 26 November 2017

Geography Fieldwork: The Do's and Don'ts

As last year's form 3 found out the hard way, fieldwork takes a lot of careful forethought. There should always be a clear and testable hypothesis, supported by a clear rationale. In addition the methodology should be sufficiently detailed so that someone else would be able to conduct the same study in the future by reading the written instructions. 

At IGCSE, Form 5 Geography students do not need to carry out their own fieldwork for their final grade. However, in paper 4 they are expected display a firm understanding of how to plan, conduct and review fieldwork and apply this knowledge to hypothetical situations.

Consequently this week Mr David's and Mr Wilkinson's classes joined together to conduct a practice piece of fieldwork about micro-climates at KTJ. After initial briefings on how to construct a hypothesis, safety and data collection the students were set loose. Most chose to investigate whether there was a positive relationship between distance from buildings and temperature.

As you will see from the videos below there were a number of issues that quickly cropped up and a number of mistakes were made. These mistakes were to be expected as Mr David and Mr Wilkinson deliberately threw the class in at the deep end. They were very useful mistakes as they provided an opportunity for reflection and a good starting point for next week's investigations. 

Below see a list of dos and don'ts that we managed to come up with as a class.

#1 Don't start before you have the right equipment

In the video below you will see that a number of students started to measure data without thinking about how they would actually ensure it was reliable.


Fieldwork ultimately aims to accept or reject a hypothesis. As a result it needs a good quantity of reliable data to analyse. Reliable data can only be collected with the right equipment at the right point. For example, as seen in this video, an investigation into temperature and distance from buildings will need a thermometer, which all students realised, but also an accurate way of measuring distance. Measuring distance could have been recorded using a number of apparatuses such as GPS on a phone, a trundle wheel or measuring tape. Nearly all students set out without any of these.

#2 Do imagine someone else will have to repeat the fieldwork


There are two issues that come up from the next video. The picture at the end shows one member of the class measuring humidity with his arm outstretched. The issue with this is that it is not particularly scientific and is open to lots of variables. For example, he is likely to be taller than others in his group so if they were take readings they would be at different heights, potentially influencing the results. On his next reading he may also have his hand at a slightly different angle or height. Better would be to follow the practice of locating Stevenson Screens and have a fixed distance from the floor where each reading is taken. For example students could take a one meter ruler and measure from the top of it. This would stop variations in height and minimise the influence of things like reflected radiation from the ground or variable amounts of wind. It would also make it easier for someone to carry out the same investigation again at a later point as they would have a clear point to measure from.


At the start of the video another member of the class is confused about which direction to face. The golden rule to remember here is that you want to remove the impact that human interference can have on the results. So in this case, this would mean ensuring that there was no shadow interfering with temperature readings. Geography investigations are different to science experiments because they operate in the real world, rather than in a controlled environment. Nonetheless, we should always try to reduce our impact on the results.

#3 Do make a results table


Even if you have followed the advice in points 1 and 2, your fieldwork will fall apart if you do not record the results properly.


In this clip the student should make sure he has made a results table to record his findings. Remember a good piece of fieldwork needs many readings. For example recordings at the same location at different times of the day. This will make the results more reliable as it will minimise the impact of freak results that could occur from faulty equipment, unusual weather conditions or human error. Eventually this student is going to run out of skin to record all of these results!

#4 Don't be afraid to read the instructions

Remember, after collecting results you need to present them in a series of graphs and charts. You also need to evaluate them, coming up with conclusions as to whether they confirm or deny your hypothesis and how you could improve the data recording if you were to do the experiment again. Consequently you need lots of results that you fully understand. 


In this clip the student was less familiar with Fahrenheit that Celsius. This means that he is less certain of what his results are actually showing him. As Mr David discusses, this problem could be easily overcome by reading the instructions on the apparatus. As in points 1,2 and 3 - fieldwork is easily improved by slowing down and thinking through problems logically.

#5 Do make a risk assessment

This video is based on photos taken by Mr Wilkinson following one group studying humidity and distance from water. Look at the images and see if you can spot anything wrong. 


Remember, as interesting as fieldwork might be, it is not worth dying for! There are risks in everything we do - even sitting in the classroom. Fieldwork is not usually dangerous, but it does involve more potential dangers than you would have in a normal lesson. For example, sun burn, animal bites, traffic and trip hazards. This does not mean we should not do it - but it does mean that we make a risk assessment before we go out so we can think about how we might minimise these risks. At KTJ this might mean students using sun-screen, wearing hats and having a teacher accompany them in places that are usually out of bounds. In paper 4 you will certainly need to mention risk management. 

Monday 20 November 2017

Life in the Cotton Mills: Form 2 Story Project

Throughout this term Form 2 have been learning about the Industrial Revolution in History. As a final task they had to create a story about life in the cotton mills for child labourers. Their stories had to use real life information from historical sources that we had analysed earlier in the term. Students then got into groups and created a video for one of their stories.

The video was set and marked using a marking rubric. All students were given the rubric before they started the task allowing them to know what was expected of them. The outcome has been fantastic and the class have been very creative, using a number of techniques to convey the conditions of child labourers including animation, green screens and acting.

Have a look at their work below. I think you will agree, for a class of EAL learners, some of whom are studying in English for the first time this year, they have done a fantastic job.

Catherine, Ben and Yee Rou

Kai Xin, Johaier and Renee


Kah Wei, Juno and Nate

Ban, Kam Jun, Yun and Vanessa


Jason, Ray and Henry


Ting Ting, Army and Miki

Wednesday 8 November 2017

The Battle of the Somme in raps and poems

On Saturday it will be 99 years since the end of WWI, arguably the most bloody conflict in human history. This term Form 3 have been studying the war's causes, conditions and consequences. 

One of the most horrific chapters of this conflict was the Battle of The Somme. A major offensive in 1916 by the British and French forces against the German army in northern France. The conditions and death-toll of this battle were horrifying and the first day of the battle remains the worst day in British military history.

Allow F3 to tell you more through the art of rap and poems...

Rattana, Zoe and Pionca


Benjy, Hong Sean, Eugene and Sonia

Melanie, Cheng Yet and Azim


Lewis, Clement et al.  


Azima and Que Bi


Well done class, some excellent work! For more information about the Somme click here.

Monday 6 November 2017

How the KTJ campus is perfectly adapted

As part of their study on climate and ecosystems, Form 5 have been out and about looking at how the vegetation around the campus has adapted perfectly to an equatorial biome. Here are a selection of their best tweets. Congratulations to Patrick who won the award for most artistic tweet and Jonathan for the most informative (he combined many photos in one).

Students - use of social media. Remember a follower on social media is just a stranger. Do not accept direct messages and speak to the school's safeguarding officer if you have any concerns. Thank you for agreeing to have your tweets shared.


Wednesday 1 November 2017

IGCSE Case Studies: Population and Migration

Form 4 have just finished studying population and migration. As part of their final assessment they have created a number of specific country case studies about the sub-topics that they have been looking at, for example population distribution, high dependency ratios and overpopulated and underpopulated countries. These case studies have helped to solidify their learning and will come-in handy for the 7 mark questions that are at the end of each paper one question in the IGCSE exam.

Below is a concise summary that will be useful for all Geographers studying at an IGCSE level. Well done class!


Friday 29 September 2017

Form 4 Tweet the Japanese Government

The news at the moment seems to be all about diplomacy being done via Twitter. Indeed President Trump barely seems to be off Twitter as this CNN article discusses. 

Not be outdone, the Form 4 Geography class have been tweeting the Japanese Government's official twitter account to warn them about the population problems that the country continues to face. A few sample tweets are included below.


The issue that the class are referring to is Japan's high dependency ratio (A high number of economically inactive people such as pensioners and school children that need to be supported by the working population). As a stage 5 country in the demographic transition model, Japan has had a long period of low birth rates and a high life expectancy. Consequently it has a high number of retirees compered to the numbers who are economically active. This puts a significant tax burden on those working who need to pay for the pensions and care that the elderly receive.The diagram below explains more.
   

By comparison Brazil is a stage 3 country in the demographic transition model. It has a high birth rate, lower life expectancy and a higher relative percentage of the population that are economically active, this means that the dependency ratio is lower. In addition, as a higher percentage of the population still work in subsistence agriculture and the informal sector there is also a lower percentage of the population drawing on pensions and elderly care provided by the state. These two factors mean that the tax requirements per worker are lower.


Why should Japan be concerned? Below is an EDpuzzle that the class worked through. It outlines some of the problems presented by having a high dependency ratio. For example lower GDP growth and the increased need for migration to maintain numbers of in the workforce. This need for migration is something that Japan is finding difficult as it remains a very racially homogeneous society as compared to other MEDCs.  


There are also less obvious problems, such as the break-down in the traditional family unit and an increase in elderly crime as this 2008 article from the Daily Telegraph explained. Needless to say Japan makes a fascinating case study for a country with a high dependency ratio.

Sunday 18 June 2017

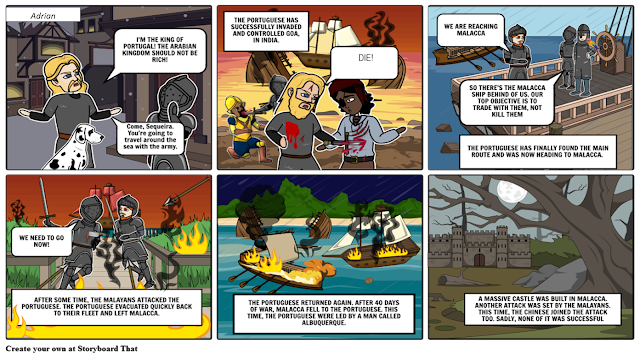
The Arrival of the Portuguese in Malaysia: Form 1 Cartoons

In term 3 form 1 have been learning about the history of Melacca (or Melka), one of the most historic towns in Malaysia.  As well as looking at the founding myth they studied the arrival of the first Europeans.

As a final task students were told to create a cartoon explaining the key events leading up to Melacca being captured by the Portuguese in the early 16th century. Below are three excellent pieces of work from Miki, Adrian and Jun Kai. Well done guys!


Tuesday 13 June 2017

Cowspiracy: Form 3 refelctions

In the last post, I gave a summary of what the documentary Cowspiracy is about and my thoughts on it. Form 3 watched a 15 minute summary of the documentary and were asked to write a brief reflection on what they watched. Below is a sample of their thoughts. Please note that all students have English as a second or third language and that the quotes have been abridged.

In the reflection below Tasha makes the link between deforestation for cattle ranching and climate change. She also talks about the potency of methane as a greenhouse gas.

"In my opinion, and from what I've seen in the video, raising cattle takes up a lot water and a lot of space which leads to cutting down trees in forest. This leads to deforestation. Deforestation plays a huge part in global warming because if there aren't trees left in this world then carbon dioxide won't be able to be taken in and there would be less oxygen given out.

Cows in this case also give out a greenhouse gas called methane, methane is worse compared to Carbon Dioxide since methane takes up 100 times more heat than carbon dioxide does. My point here is that the more meat we eat, more methane will be given out which rises the global temperature, which leads to the melting of the ice and to the rise of sea levels which soon may cover up almost the entire planet.In order to prevent this, there is a way we could help. Vegetarian [sic] is a good way because it decreases our consumption on meat and it also help us to become healthy."


Jenny takes a more critical view. I agree with her assertions of over-exaggeration in the movie and that vegans are still causing some harm, although the idea of the same damage can be challenged by the idea that most of the energy from grazing is lost and not put into meat.

"I have one point to make: they said deforestation (clearing land to grow crops, plus, feeding livestock) is damaging the planet’s so-called ‘lungs.’ Aren’t the plants that they eat, grown on that same land too? Don’t plants consume the very huge amount of water too? Just saying, vegans are also harming the planet, no different from non-vegans....
I feel that the video was pretty informative, however, I think it was being a little pushed and exaggerated with numbers and how turning into a vegan is the only way to save the earth."


Zhi Heng and Prathna point to people as the big problem.

ZH: "Cattle in USA is the biggest cause of greenhouse gases because when a cattle [sic] digest food, it creates methane, Methane made today's amount of greenhouse gases increases rapidly...
Nontheless, it's not the animals fault. In last two century[sic], our population increased rapidly together with animals..."

P: "In the movie/ short clip that we were shown, it says methane is created from a cow's digestive system- and that cow's produce more green-house gas then all vehicles combined. It also mentions that if you reduce methane emission, the level of the atmosphere goes down or decreases- but we are forgetting more methane would be produced because of our growing population, as our numberS grow or increase, animal agriculture would too as we need to be fed. So i wouldn't put all the blame on the animal agriculture or cows when our population is multiplying minutes by minute."


Kenneth makes the link to what we are doing at KTJ.

"I was shocked when I watched that video. I think that the amount of water needed to feed animals or making meat is huge. I was shocked that 51% of greenhouse gases were given out by animals. I just realised that cattle farming can cause deforestation. I think it is also our fault because we demand a huge amount of meat. I think that meat free Monday is a good idea in KTJ because it saved a huge amount of water used to make meat."

Monday 12 June 2017

Cowspiracy and Climate Change

In the last few weeks of term Form 3 have been looking at man's impact on the environment, most particularly the release of greenhouse gases like CO2 and methane, two major contributors to global warming. Initially we focused on fossil fuels, the most publicised source of greenhouse gasses, before moving onto a new frontier in climate change policy; increasing meat consumption. As part of their study they watched a 15 minute summary of Cowspiracy.

Cowspiracy,  a feature length documentary directed by Kip Anderson, is about the damage that cattle farming and livestock agriculture in general is having on the environment. It looks at a numbers of factors including, water usage, greenhouse gases, reductions in biodiversity, forest clearances for pasture and water pollution. There are some startling facts in the film, for example...


The film calls for a massive campaigning refocus by environmental charities like GreenPeace and a fundamental shift in the human diet, away from meat and dairy products and towards Veganism. Unsurprisingly it ruffled quite a few feathers and led to an angry backlash from many, especially in the meat industry. Indeed Beef Daily, a farming magazine, responded with an article called 6 Reasons To Ignore The “Cowspiracy” And Eat A Burger

As a farmer's son and a Geographer I disagreed with some of his findings, but it did give me a lot to reflect on and has influenced they way I think about what I eat. You can download and buy the full documentary at http://www.cowspiracy.com/ or stream a 15 minute summary below. Whether you are convinced about the vegan argument or not, I thoroughly recommend watching the documentary.


Some suggested tasks for teachers:

TASK: Either through watching the full documentary, or taking the two cheat routes 1.) by watching the selected clips here, or 2.) Skipping to the minute and second flags, answer the following questions:

1.) How much time on the planet might we have left?  3 mins,17 seconds
2.) What produces more gasses than the entire transportation sector, how much more do they produce?  4 minutes 27 seconds
3.) How many gallons of water is used in the US annually for raising animals?  5 minutes, 57 seconds
4.) How many gallons of water is used to create and egg?  9 minutes, 30 seconds
5.) How fast is the rainforest being cut down   15 minutes, 03 seconds
6.) Describe the situation in the world's oceans 23 minutes, 30 seconds

Task 2: If you are not prepared to become a vegan, how might you reduce you impact on the environment? Come up with three ideas and explain how they will help.

Hint - think about things like water use, greenhouse gases, non-renewable resources.

Sunday 11 June 2017

How caves, arches and stacks form - Form 4 Playdoh explanations

Winner of best Geographical explanation
In this diagram Leia demonstrates that headlands are not only eroded from the furthest seaward point backwards, but also from the sides due to wave refraction. There is also a good use of key terminology such as corrasion. Corrasion is where sediment within the sea are thrown against the cliff by waves, helping to accelerate erosion.

Runner up
Deen's explanation of how a headland is eroded is very clear, showing the sequence of erosion from a fault to the stump. He also mentions key types of erosion such as hydraulic action, where the force of the wave compresses air inside the cracks of the rock. This form of erosion helps to deepen and widen points of weakness in the rock forming arches such as Piercy Rock in New Zealand's Bay of Islands.

The only minor criticism is that his explanation of a blowhole would have been better located under the heading for a fault.

Winner of most artistic headland
Although there is not much in the way of explanation about how these features are formed, this model of a headland by Macy is very clear. You can see the clear progression of erosion from sea cave, to arch, collapsed arch and then stump. It is also very artistic with her use of rocks, sand, plants an cellophane sea - great improvisation and a step above what I expected when I handed out Playdoh.

Other honorable mentions....

Below, Rachel shows well the action of refracted waves and the low and high tide mark.

Adam shows how sediment in the sea helps to erode the headland.

Brittany clearly shows the direction of retreat.


Saturday 6 May 2017

Ed Puzzle: The Formation of Waves

Form 4, should you be unable to log-in to Edpuzzle here is the video that you will need for your task sheet on the formation of waves.


Atlas Race: F1 Scores (FINAL SCORES!)

Form 1 are on a quest! They are trying to visit every country in the world. To do that they need to answer 20 questions a week on cities, countries, continents or natural features of the world.

Each correct answer counts for one country visited. They are visiting each country in alphabetical order - from Afghanistan to Zimbabwe. First to Zimbabwe (196) wins a prize!


To check the leader-board and weekly progress of each student see the slides presentation below. You will be able to see a map of each country they have chalked off so far.

UPDATED 26/05/17 - FINAL SCORES

Monday 24 April 2017

The founding myth of Melaka

In history, form 1 have started looking at Malayisan history this term. This morning we looked at the founding myth of Melaka, a famous Malaysian city just a few hours drive to the south of KTJ. 

In today's lesson students looked back to their study of the Romans and thought about when they studied a myth and what a myth means. They correctly suggested that a myth is an interesting story that contains bits of truth and bits of fiction and that the story of Romulus and Remus and the start (founding) of Rome was a good example of a myth.


Students were given half of the cartoon above and were asked to write a summary of the story, before pairing up with someone with the other half of the story and explaining and the listening to understand the whole story. They then acted out the story as part of a group to demonstrate understanding.

For teachers you can make your own story board by clicking the link - Made with Storyboard ThatYou can also download this story board I made directly by clicking this link

Thursday 20 April 2017

Features of the upper-course of a river (F4 Video Project)

In the second term form 4 have been studying rivers, including the upper course features. The upper course is an area of vertical erosion caused by abrasion. There is little horizontal erosion.

As part of their effort to create case studies for their exams, form 4 created video projects of major features found in the upper course, namely waterfalls, V-shaped valleys and potholes.

These were marked by using a marking rubric. Out of 60, these three groups received marks of 44, 36 and 32. Can you match the scores to the videos?


Thursday 23 March 2017

Good sample projects Form 3 Wifi course work

This term Form 3 looked at wifi connectivity in KTJ. This was their first ever piece of Geography fieldwork. For many it was the first time that they had full control of their own learning. The students were on their own other than an initial lesson on what makes a good hypothesis, scaffolding for the final project (what sections needed to be included and a marking rubric) and comments on their first draft. It is fair to say that many found it difficult and the final projects were not what they might have been.

Here are some anonymised good examples of fieldwork that was produced by students in other classes at KTJ. These case studies were used as part of a debrief when students were asked to assess where the project went well and where it could be improved upon. 

These case studies are good because they have a clear method that makes it clear to anyone who would want to repeat the experiment exactly what they would need to do. They also go beyond displaying the results, and actually interpret what they show and evaluate how more accurate results could be gathered if the experiment were to be repeated again. This is that many students failed to do this time. 

For anyone in form 3 reading - it is fine that the first attempt didn't go as well as it should have. The important thing to do is make sure that you learn from your mistakes!


Wednesday 8 March 2017

Form 1 History Project - The Battle of Hastings Videos

This term Form 1 have been studying the battle for the English throne in 1066. This was a key part of English history as it was the last time that England was successfully invaded. The winner of the three way battle, William of Normandy, also transformed how England was run for the next 500 years to come. His rise to the throne is usually seen as the start of The Medieval Era.

Unsurprisingly, as most of the class have never set foot in Europe before, many of the students struggled with all the place names and people at the start. However, with lots of scaffolding from me, hard work and boundless enthusiasm from them, they have been able to explain in detail the key events of the period. Their final task was to produce a group video presentation describing the events of 1066.

These videos were based on the content covered in the class. Students worked in groups of three or four. They were given a marking rubric to follow which reminded them what to include and what they needed to do to gain marks. 

Take a look at what the students were able to produce. As a teacher I have done no editing, only just occasionally pointed them in the right direction. All students have English as a second language and are studying European history for the first time. I think you will all agree that they have all done a great job!

Kar Li, Vanessa and Yun

Jack, Catherine and Tommy

Army, Zhi Shan and Jun Kai

Adrian, Yee Rou, Kok Sen and Kai Xin

Farhan, Kah Wei and Jason


Ghana and Millennium Development Goals (Edpuzzle)

This week in Geography form 3 have been continuing to look at global inequality. As part of this we have looked at the UN's Millennium Development Goals (MDGs).

Eight MDGs were set in 2000 that ran for 15 years until 2015. These goals committed the world to campaigns that would benefit humanity and the world as a whole. For example the first goal was to eradicate extreme poverty and world hunger, whilst number 5 aimed to improve maternal health. For more information follow the link to the UN here.

The Edpuzzle below is based on a news report from Ghana. It was recorded in 2011, four years before the end of the goals. As you will see, Ghana did well with some of its goals, but struggled with the provision of adequate sanitation, a part of the seventh MDG - Ensure Environmental Sustainability. If you watch right until the end, you might see a familiar (but younger) sight.

Monday 6 March 2017

Staff Review

Now in my third year at KTJ, I have been fortunate enough to have been involved in three staff-reviews. The staff review is a Saturday evening where KTJ teachers put on a night of entertainment for all of the boarders. It is a highlight of the year for many staff and students. In previous years I have compered the event, danced to Bollywood, embarrassed myself in a mamak stall skit and been shown up that I am not smarter than a Form 1!

The event showcases why KTJ is a great school to be at. Teachers and students have a close respectful relationship. More importantly the teachers don't take themselves too seriously -  I think this year's whole staff video - a take on the Chinese song "Xing Ping Guo" proves that. Watch carefully for my sprinkler move!


Friday 17 February 2017

Eruption Case Study - Mount St. Helens

As part of their Geography IGCSE course, form 4 have been studying famous volcanic eruptions that would serve as good case studies for their final exam. Below is a well researched case study of Mount St. Helens in The United States by Brittany.

Mount St. Helens had a well documented eruption in 1980. Below Brittany tells us more...


Thursday 16 February 2017

Eruption Case Study - Krakatoa

As part of their Geography IGCSE course, form 4 have been studying famous volcanic eruptions that would serve as good case studies for their final exam. Below is a well researched case study of Krakatoa in Indonesia by Macy.

Krakatoa erupted in 1883 and was one of the most deadly eruptions in history. Let Macy tell you more...

Sunday 12 February 2017

Indian Ocean Tsunami EdPuzzle


Earthquakes are formed by friction between plates being released. A common secondary impact of earthquakes that happen out to sea are Tsunami's. The deadliest in living memory was the Boxing Day Tsunami in 2004.


Watch my EDPuzzle below and answer the questions to find out more about how it was formed and the impact it had.